Production Information
| Product Information | |
|---|---|
| Storage | 2-8℃ |
| Validity Period | 6 months |
| Unit | Box |
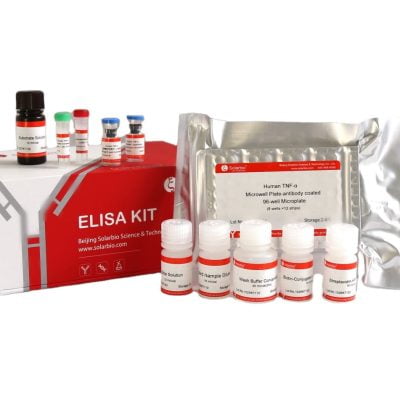
| English Name | Human IL-1β ELISA KIT |
| Reactivity | Human |
| Sample Type | Serum, plasma, Cell culture supernatant |
| Sensitivity | 2 pg/ml |
| Detection Target | IL-1β |
| Application | Sandwich ELISA |
| Specification | 48T, 96T |
Product Background
IL-1β has a homology ranging from 60% to 70% across different species and 75% to 78% within the same species; however, within the same species, the homology between IL-1α and IL-1β is only 25%. IL-1β is primarily produced by monocytes and macrophages in the blood. It is also produced by astrocytes, oligodendrocytes, adrenal cortex cells, NK cells, endothelial cells, keratinocytes, megakaryocytes, platelets, neurons, neutrophils, osteoblasts, Schwann cells, trophoblasts, T cells, and fibroblasts. IL-1 has extensive immunoregulatory effects, and it also has pyrogenic and inflammation-mediating properties.
Detection Principle
- The Solarbio® ELISA kit uses a double-antibody sandwich enzyme-linked immunosorbent assay (ELISA) technique.
- Anti-human IL-1β monoclonal antibodies are coated onto the wells of a microplate.
- Gradually diluted standards and pre-diluted samples are added to the wells.
- Human IL-1β in the standards and samples binds to the coated antibodies.
- After washing, a biotinylated anti-human IL-1β antibody is added.
- This antibody specifically binds to the human IL-1β captured by the coated antibodies.
- Following another wash, horseradish peroxidase (HRP)-labeled streptavidin is added.
- Streptavidin binds strongly and non-covalently to the biotin.
- After a final wash, a TMB substrate solution is added.
- HRP converts the colorless TMB into a blue color of varying intensities, positively correlated with the concentration of human IL-1β.
- After adding the stop solution, the wells turn yellow.
- The absorbance (OD) of the samples is measured at λmax = 450 nm (OD = 450 nm).
- The concentration of human IL-1β in the samples is directly proportional to the OD values.
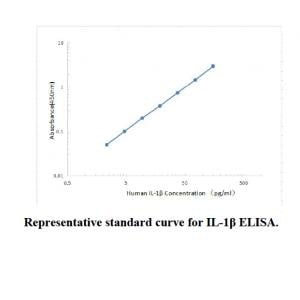
- By plotting a standard curve and using four-parameter logistic regression software, the concentration of human IL-1β in the samples can be calculated.
More Details can be found in the in-box instruction

Reviews
There are no reviews yet.